Normal Distributions
Normal distribution is a continuous probability distribution that describes many natural datasets. It is also known as bell curve or Gaussian distribution.

It possesses the following properties.
- The distribution is usually symmetric to the mean (μ) - half of the data will fall into left, half to the right of the mean.
- Mean, median and mode are equal
- ≈ 68% of the data falls within 1 standard deviation of the mean
- ≈ 95% of the data falls within 2 standard deviation of the mean
- ≈ 99.7% of the data falls within 3 standard deviation of the mean
Normal distribution and variance
If the variance of the dataset is high, the curve tends to look flat. If variance is low, curve is more steeper.

Z-scores
Example: A dataset representing highest scores of cricket batsmen in One-Day International matches - given average (μ) = 128, standard deviation (σ) = 25.
If a batsman has a highest score of 103, what is the z-score?
Z-score =
i.e. a highest score of 103 is 1 standard deviation below the mean
Z-table
Z-table (or standard normal table) is used to map from z-scores to percentiles. For the above example, what is the percentile for a highest-score of 103 (i.e. z-score = -1) ?

Z-table is available online or we can use scipy.stats package.
import scipy.stats as st

z_score = st.norm.cdf(-1)
print(f'z-score of -1 = {z_score * 100:.2f} percentile')
z-score of -1 = 15.87 percentile
Probability density function (PDF)
The probability density function of the normal distribution is given by,
Or in terms of z-score (z),
Let's try to plot one using matplotlib
Reference:
numpy.random.normal
import numpy as np
import matplotlib.pyplot as plt
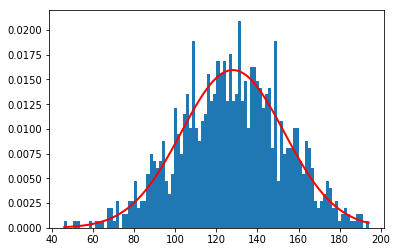
mu, sigma = 128, 25 # From the above example
highest_scores = np.random.normal(mu, sigma, 1000) # Random 1000 values
count, bins, _ = plt.hist(highest_scores, 100, normed = True) # plot 100 points
plt.plot(bins, 1/(sigma * np.sqrt(2 * np.pi)) *
np.exp( - (bins - mu)**2 / (2 * sigma**2) ),
linewidth = 2, color = 'r') # Plot the PDF
plt.show()