Covariance and Correlation
Joint Random variables
More often, in real life, we see two or more random variables related to each other. For example, height of a person is related to weight of a person. Amount of investment is related to amount of return. Or maybe two variables are not related at all, but can occur jointly - flipping a coin and rolling a die.
For simplicity, let's take two random variables A and B.
A = flipping a coin, B = rolling a die
In statistics, we measure how strongly two random variables are related by two metrics - Covariance and Correlation.
Correlation
Positive correlation
A positive correlation exists between two variables A and B when A increases, B also increases and B decreases when A decreases. Graph between A and B would look like the following.

Examples
- Height v/s Weight of a person
- Walking distance v/s calories burnt
- Product quality v/s sales
Perfect Positive correlation
A perfect positive correlation exists if there is a positive linear association between two variables. Which means, given variable A, we can exactly predict the value of B by multiplying with a positive number.

Examples
- Length of a square v/s it's circumference
- Weight in kilos v/s weight in pounds
Negative correlation
A negative correlation exists between two variables A and B, if A decreases when B increases and A increases when B decreases.

Examples
- Mobile screen time v/s remaining battery percentage
- Current run rate v/s Required run rate (in Cricket)
Perfect Negative correlation
A perfect negative correlation exists if there is a negative linear association between two variables.

Examples
- Power v/s focal length of a lens
- Frequency v/s wavelength of light
Zero correlation
If two variables are independent of each other, then there is no correlation or zero correlation.

Examples
- Bitcoin price v/s speed of light
- Your mobile usage per day v/s neighbor's electricity bill
Calculating covariance and correlation
import numpy as np
import matplotlib.pyplot as plt
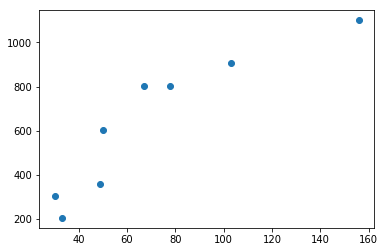
x = np.array([50, 30, 67, 103, 49, 156, 33, 78])
y = np.array([601, 304, 801, 905, 359, 1100, 205, 801])
plt.scatter(x, y)
def covariance(x, y):
    if len(x) != len(y) or len(x) < 1: return None
    mean_x, mean_y = np.mean(x), np.mean(y)
    numerator = np.sum([(a - mean_x) * (b - mean_y) for (a, b) in zip(x, y)])
    return numerator / (len(x) - 1)

def correlation(x, y):
    cov = covariance(x, y)
    if cov: return cov / (np.std(x, ddof=1) * np.std(y, ddof=1))

print(f'Covariance = {covariance(x, y)}')
print(f'Correlation = {correlation(x, y)}')
Covariance = 12194.142857142857
Correlation = 0.9072220542468226
Variance of sum and difference
If we have two random variables X and Y,
Variance of X + Y is given by,
Variance of X - Y is given by,